Function Models are diagrams used to depict the activities performed by a system or organization. Function models typically demonstrate an activity or group of activities along with the inputs, outputs, mechanisms, and constraints associated with the activity. While some function models do show relationships between two or more functions these diagrams are not intended to communicate the sequencing or timing of a function.
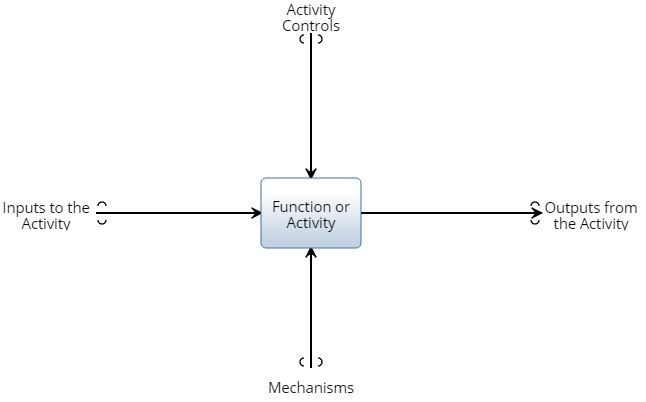
Two examples of function models are IDEFO Input, Control, Output, Mechanism (ICOM) Diagrams and Input/Process/Output (IPO) Models. These diagramming approaches are an effective way of visualizing a process from the top level. Figure 1 depicts the typical structure of an IDEF0 Activity Diagram.
Figure 1 is an example of an function model for one activity.

The block in the center of the diagram represents and activity or function performed in a process. Each activity / function can have one or more Inputs, Outputs, Mechanisms and Constraints.
Inputs are items that are modified or consumed by the activity / function. (Raw material, components, assemblies, data or information)
Outputs are items that were modified or created during the activity / function (Components, assemblies, data or information). Inputs do not normally pass through an activity without being modified.
Controls are items that influence or direct how the function is to be performed or the characteristics of the functions's outputs. For example, regulations may state safety considerations or design specifications may define the structure or characteristics of the output.
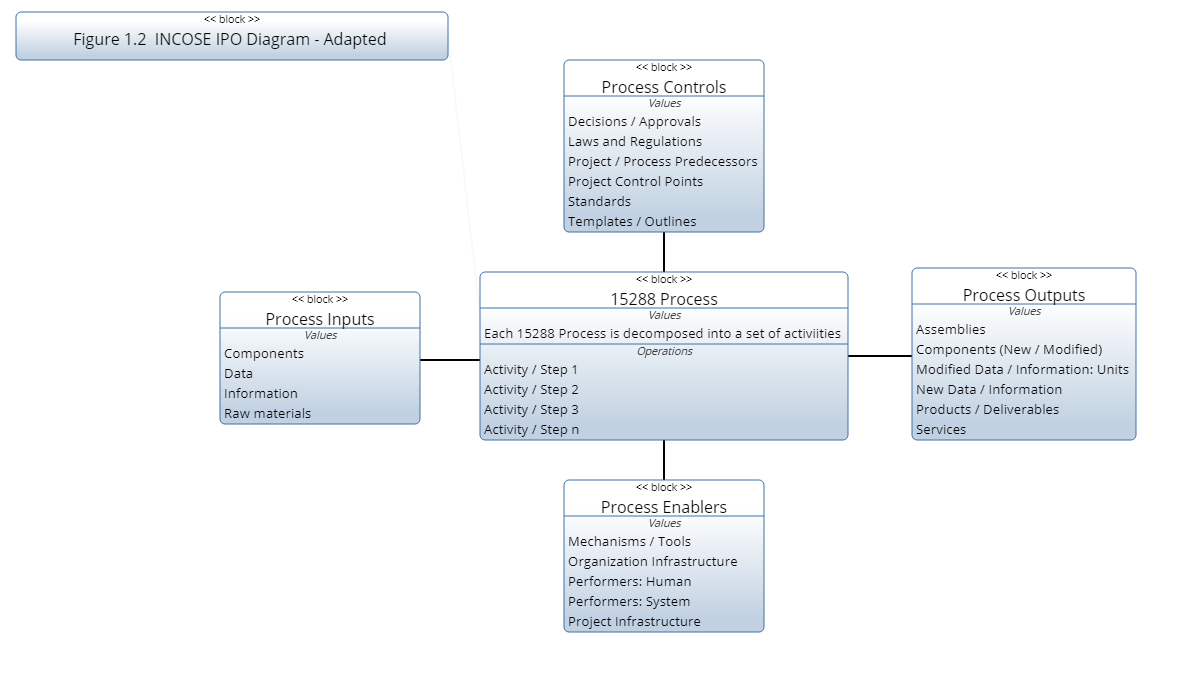
Figure 2 is a recreation of the INCOSE SEH IPO Model structure used in the INCOSE Systems Engineering Handbook (INCOSE 2015).

Figure 3 is an example of an IPO diagram adapted from the INCOSE handbook. The model represents the Inputs, Outputs, Activities, Controls and Mechanisms for the Business or Mission Analysis process (INCOSE 2015).

The activity box in the center of Figure 3 lists the five activities listed by INCOSE 2015 for this process. In most cases, all of these activities are performed during the process. What changes from project to project is the level of detail and the sub activities performed under each of these top level activities.

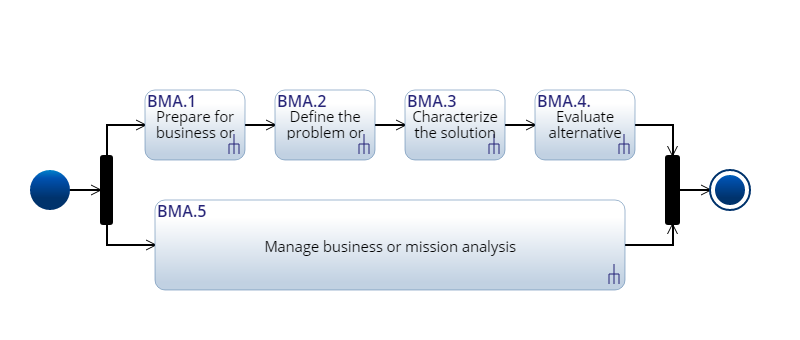
Figure 3 is a SysML Activity Model for the same process. An activity model
These models were created using an integrated model based systems engineering tool (MBSE). In the tool there is a direct correlation between the activities listed in the center of Figure 3 and the Activities shown in each of the boxes in Figure 4. Inside of the tool, each entity is singular and is inserted into the two diagrams. When working in the tool changes to the entity in one diagram and the changes will automatically be reflected in other diagrams containing the entity.
For more information on IDEF and UML see the following references:
https://en.wikipedia.org/wiki/Function_model
www.idef.com
https://www.smartdraw.com/uml-diagram/#UMLTypes
http://www.omg.org/spec/UML/2.3/