Introduction
This article provides Activity Diagrams to use in Systems Engineering Activities. These diagrams are the result of our Analysis multiple sources associated with SE practices. The intent of this article is to further expand on our articles about SE processes by providing:
- sources and references cited
- connections to other professional handbooks,
- increased fidelity for activities,
- examples of process application,
- lessons learned, and
- recommended best practices.
Sources Used for this Article
International Council on Systems Engineering (INCOSE)
This article references the processes described in the INCOSE Systems Engineering Handbook prepared by the International Council on Systems Engineering (INCOSE).The Handbook is published by John Wiley and Sons of Hoboken, NJ, USA.
Handbook Structure and Methods
INCOSE adopts and expounds upon the systems engineering processes described in ISO/IEC/IEEE 15288. INCOSE does not define new processes, rather it provides amplifying information on the application of the processes defined in 15288 (INCOSE 2015). Figure 1 is adopted from INCOSE 2015 which is adopted from (ISO/IEC/IEEE 15288).
-
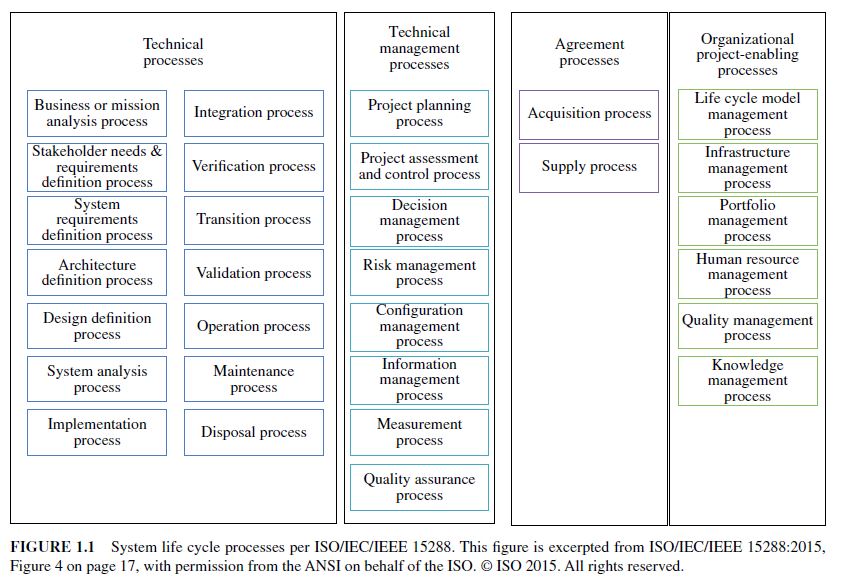
Image adopted from INCOSE Systems Engineering Handbook Fourth Edition. 2015 p2
The processes in 15288 are divided into four functional categories: Technical, Management, Agreement and Organizational project-enabling. The purpose of the Technical and Management process areas are self explanatory. The Agreement process area is intended to describe how the systems engineering IPT is to acquire outside goods and services.
The Organizational Project Enabling Process Area describes the methods performed by the greater organization to establish and maintain mechanisms to support all projects executed by the organization.
CABOKtip This Agreement Process area is similar to the PMBOK Project Procurement Management Knowledge Area which includes the process areas: Plan Procurement Management, Conducting Procurements and Controlling Procurements Knowledge Areas within the PMI Project Management Body of Knowledge (PMBoK) (PMI 2017).
CABOKtip The Organizational Process Area area is analogous to the Organizational Process Assets a within the PMBoK (PMI 2017).
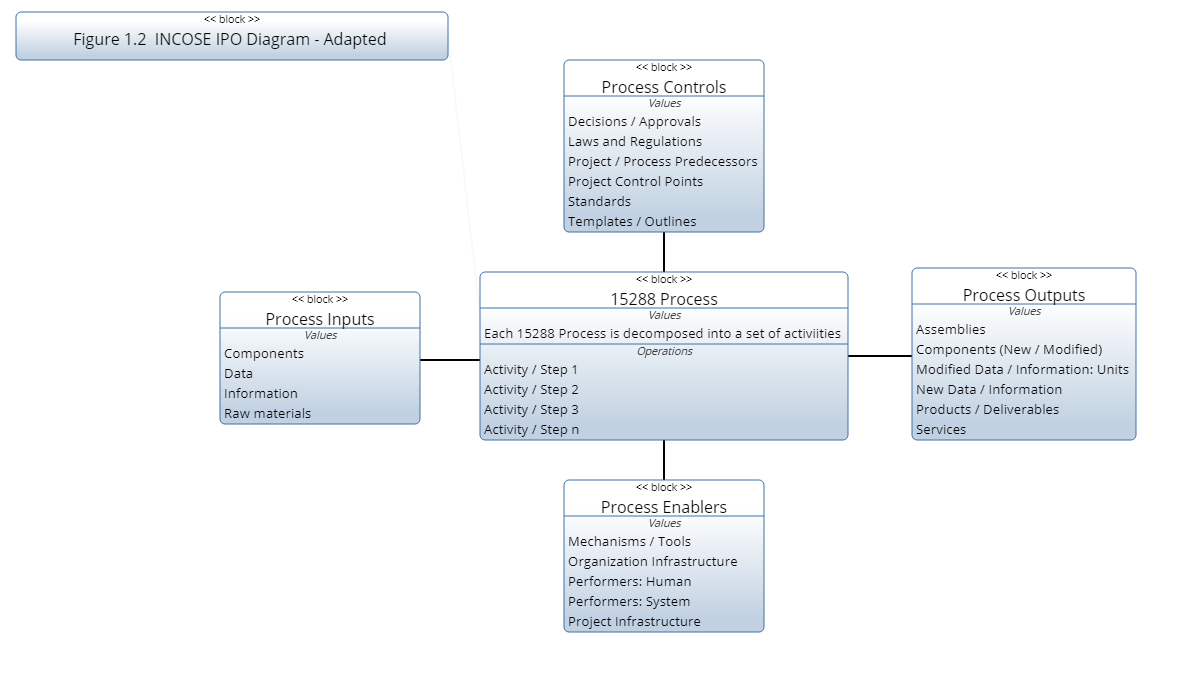
The INCOSE SE Handbook uses process models to depict each process along with its inputs, outputs, mechanisms and constraints. The models are consistent with IDEF0 Activity Diagrams and Input/Process/Output (IPO) Models. This diagramming approach is an effective way of visualizing a process from the top level. Figure 2 depicts the typical structure of an IDEF0 Activity Diagram.
Figure 3 is an example of an activity model for one activity.
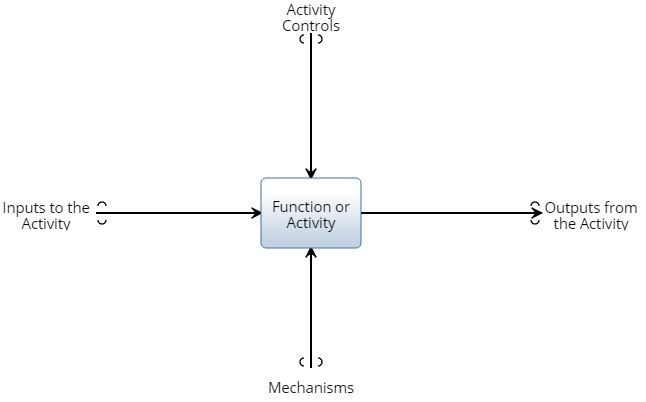
The block in the center of the diagram represents and activity or function performed in a process. Each activity / function can have one or more Inputs, Outputs, Mechanisms and Constraints.
Inputs are items that are modified or consumed by the activity / function. (Raw material, components, assemblies, data or information)
Outputs are items that were modified or created during the activity / function. (Components, assemblies, data or information) Inputs do not normally pass through an activity without being modified.
Controls are items that influence or direct how the activity is to be performed or the characteristics of the outputs. Regulations may state safety considerations and design specifications may define the structure or characteristics of the output. An example of a regulation is environmental policy.
Figure 3 is a recreation of the INCOSE SEH IPO Model structure (INCOSE 2015). In this case a SysML Block Definition Diagram was used to recreate the layout depicted in the INCOSE SEH.
Technical Processes
Business or Mission Analysis Process
Please refer to Section 4.1 on Page 49 of the INCOSE 2015 for foundational information (INCOSE 2015).
Figure 4 represents the Inputs, Outputs, Activities, Controls and Mechanisms for the given process.
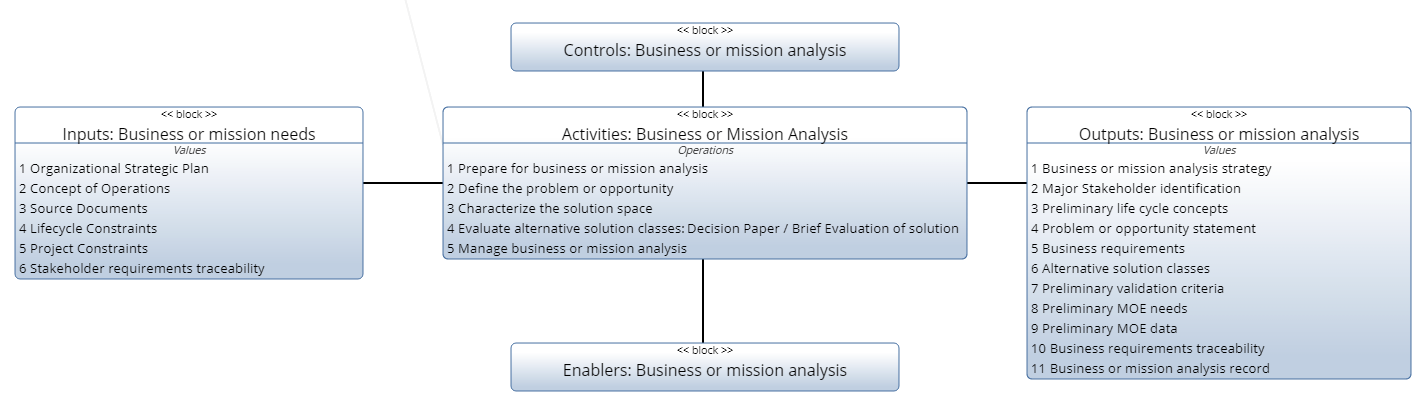
The activity box in the center of Figure 4 lists the five activities listed by INCOSE 2015 for this process. In most cases, all of these activities are performed during the process. What changes from project to project is the level of detail and the sub activities performed under each of these top level activities.
CABOKtip: Since these models were created using an integrated model based systems engineering tool (MBSE), there is a direct correlation between the activities listed in the center of Figure 4 and the Activities shown in each of the boxes in Figure 5. Inside of the tool, each entity is singular and is inserted into the two diagrams. When working in the tool changes to the entity in one diagram and the changes will automatically be reflected in other diagrams containing the entity.
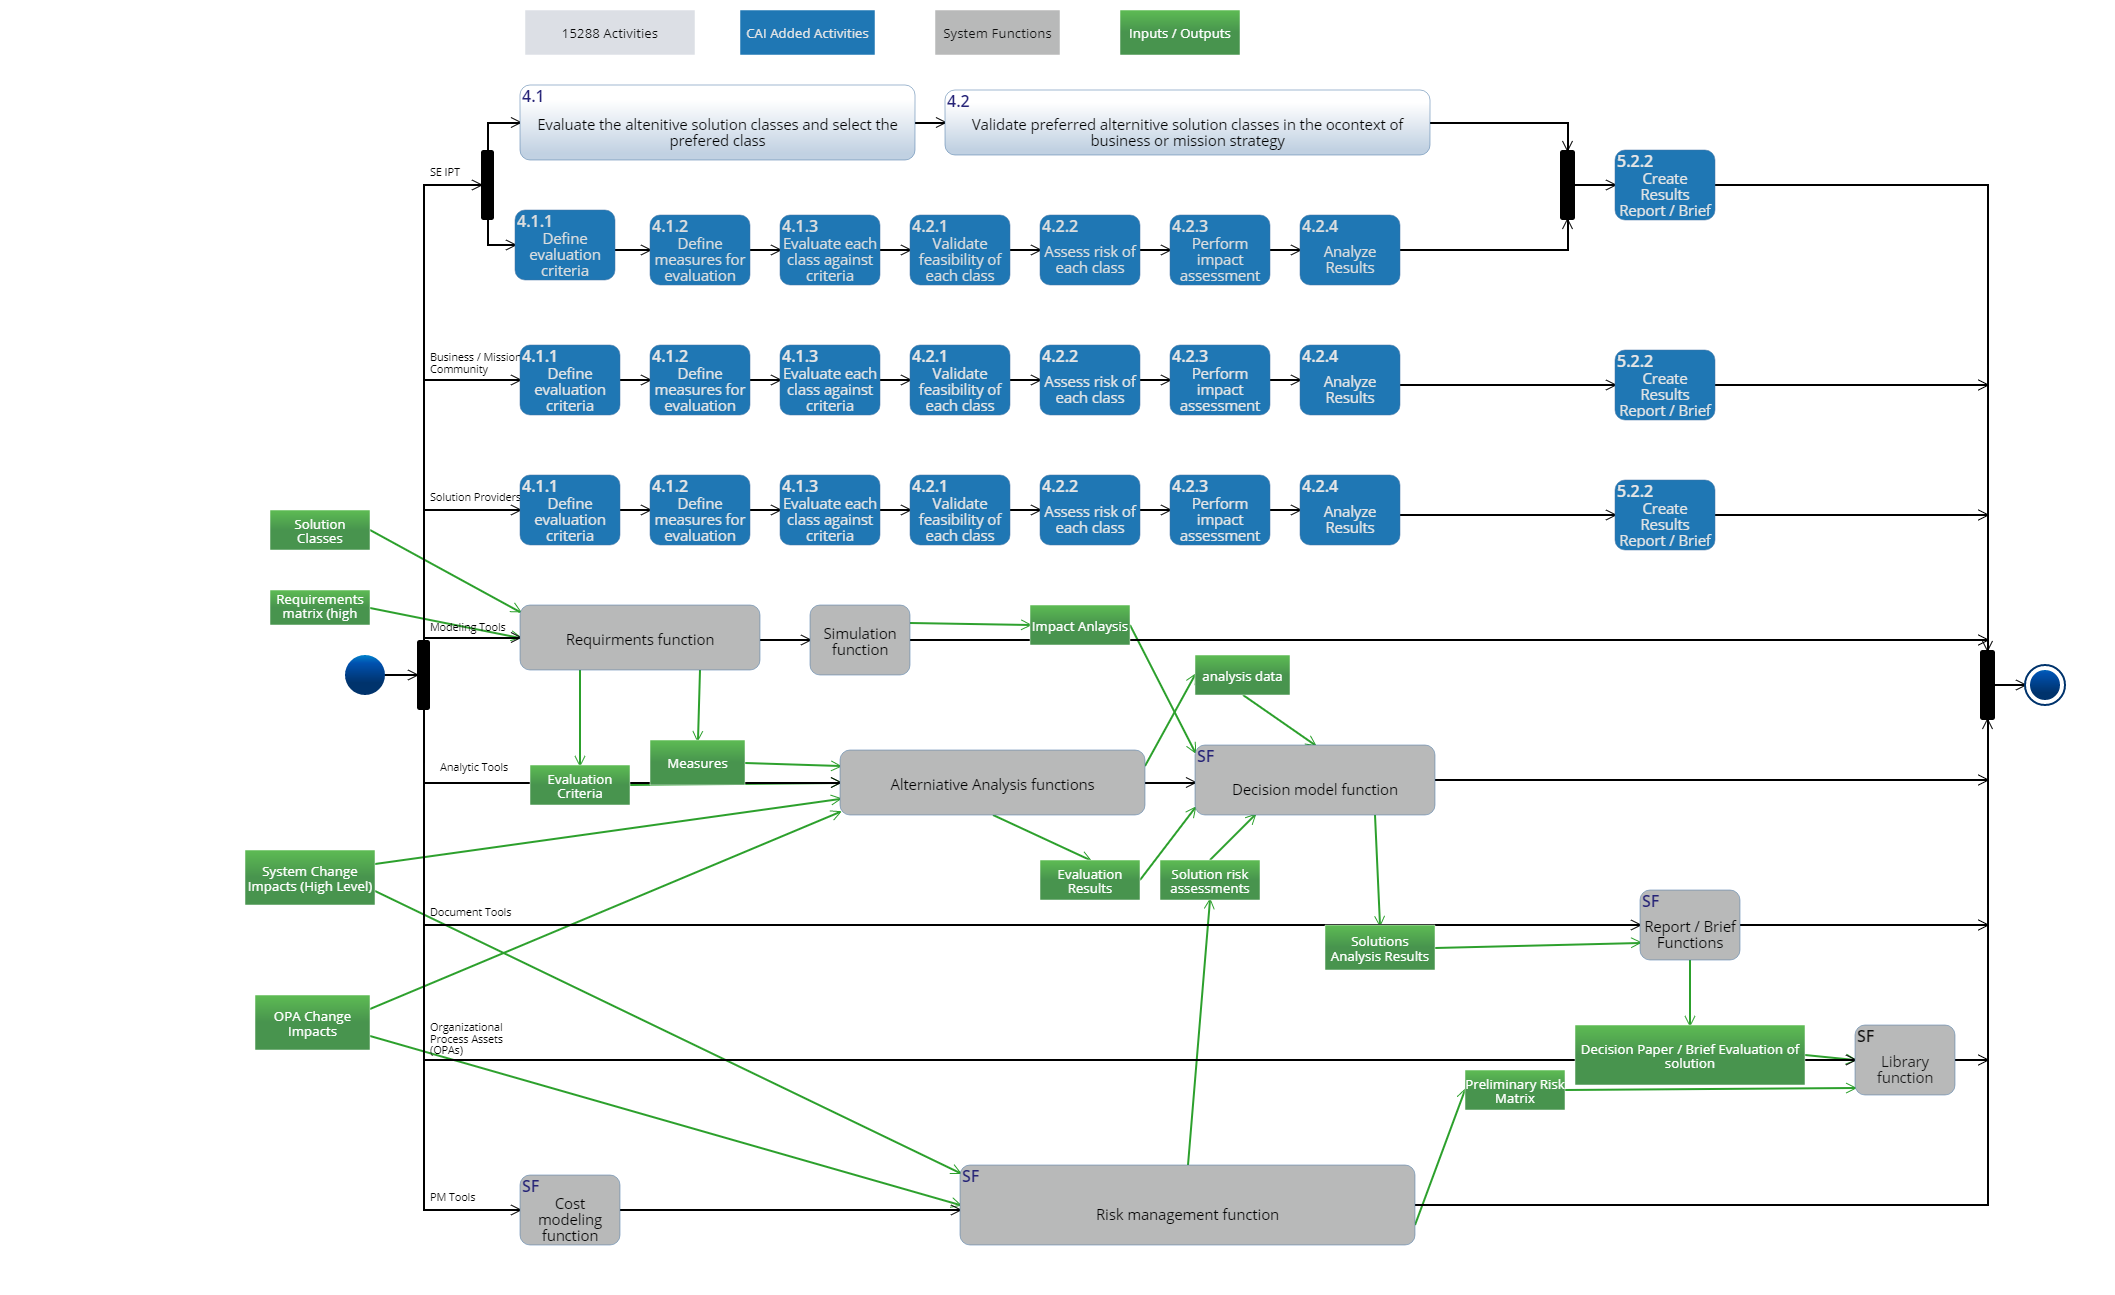
Figure 5 depicts the general the sequence or concurrency for performance of the activities. Also shown are the swim lanes for organizations participating in the analysis. At this top level, the swimlane list is also very generalized. As we drill into each activity the performer list will increase. Notice that when activities involve 2 or more parties, the activity is reflected on each of the swim lanes. The Trident symbol in each activity denotes the existence of child processes for the activity.
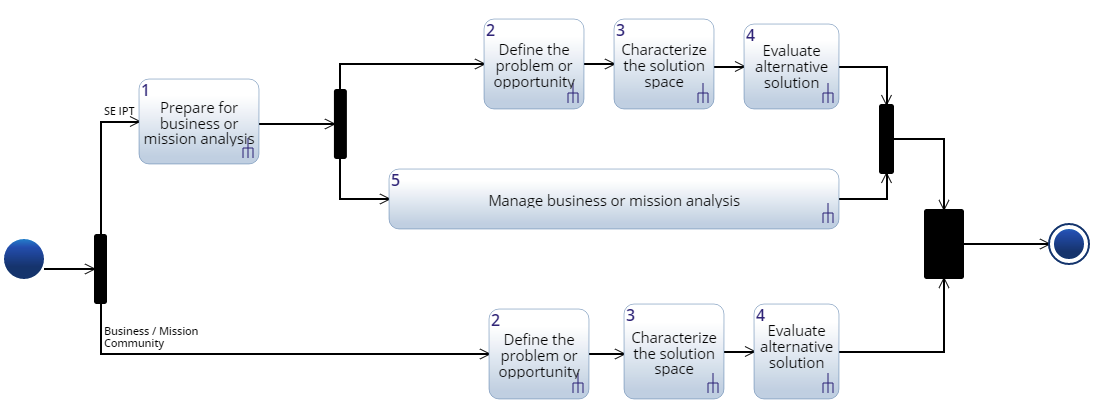
CAItip: The diagramming technique shown here is SysML Action Diagrams, another type of popular swim lane diagram is the Business Process Modeling Notation (BPMN).
CAItip: SysML Activity Diagrams and BPMN Diagrams differ from IDEF0 and IPO diagrams in that the Enablers are the swim lanes and the Inputs and Outputs can connect on any side of the activity block. Constraints are not depicted on these diagrams.
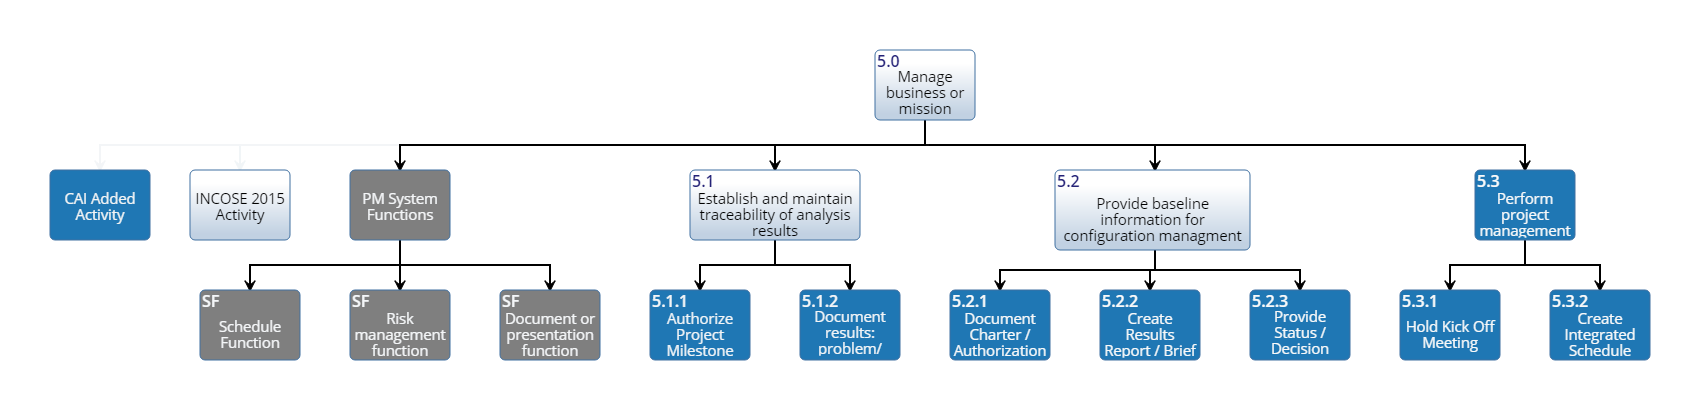
Manage Business or Mission Analysis
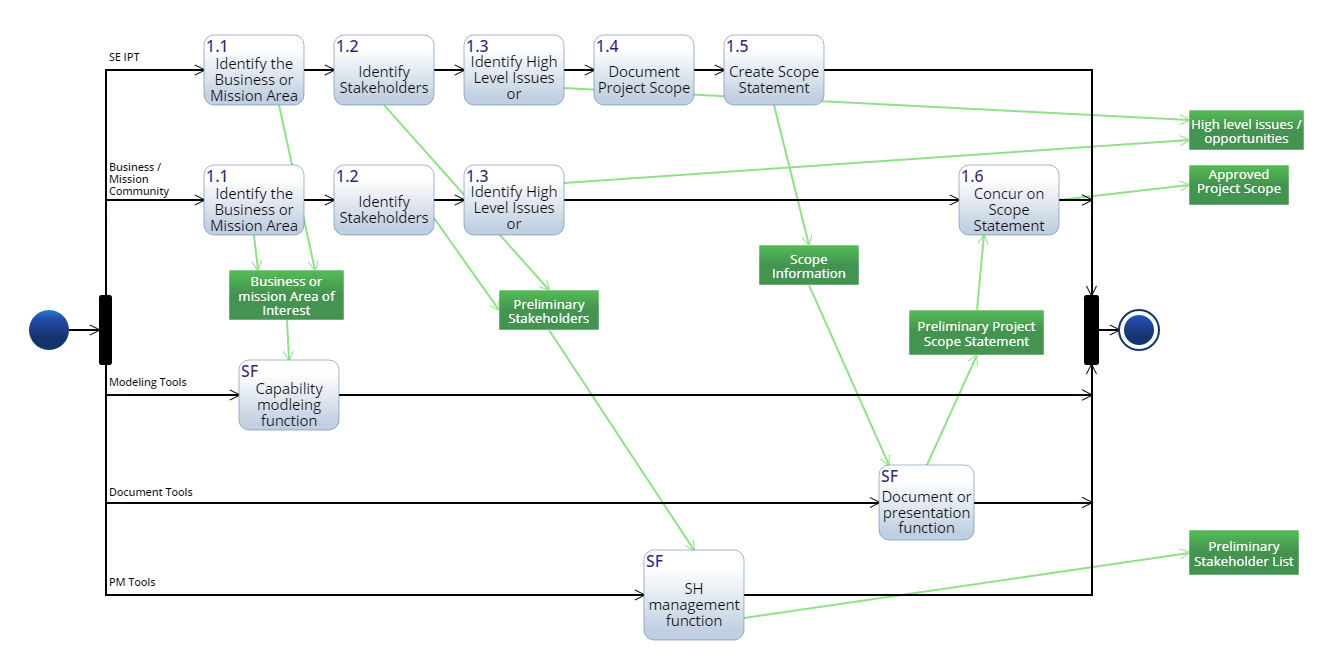
Prepare for Business or Mission Analysis
Define the Problem or Opportunity
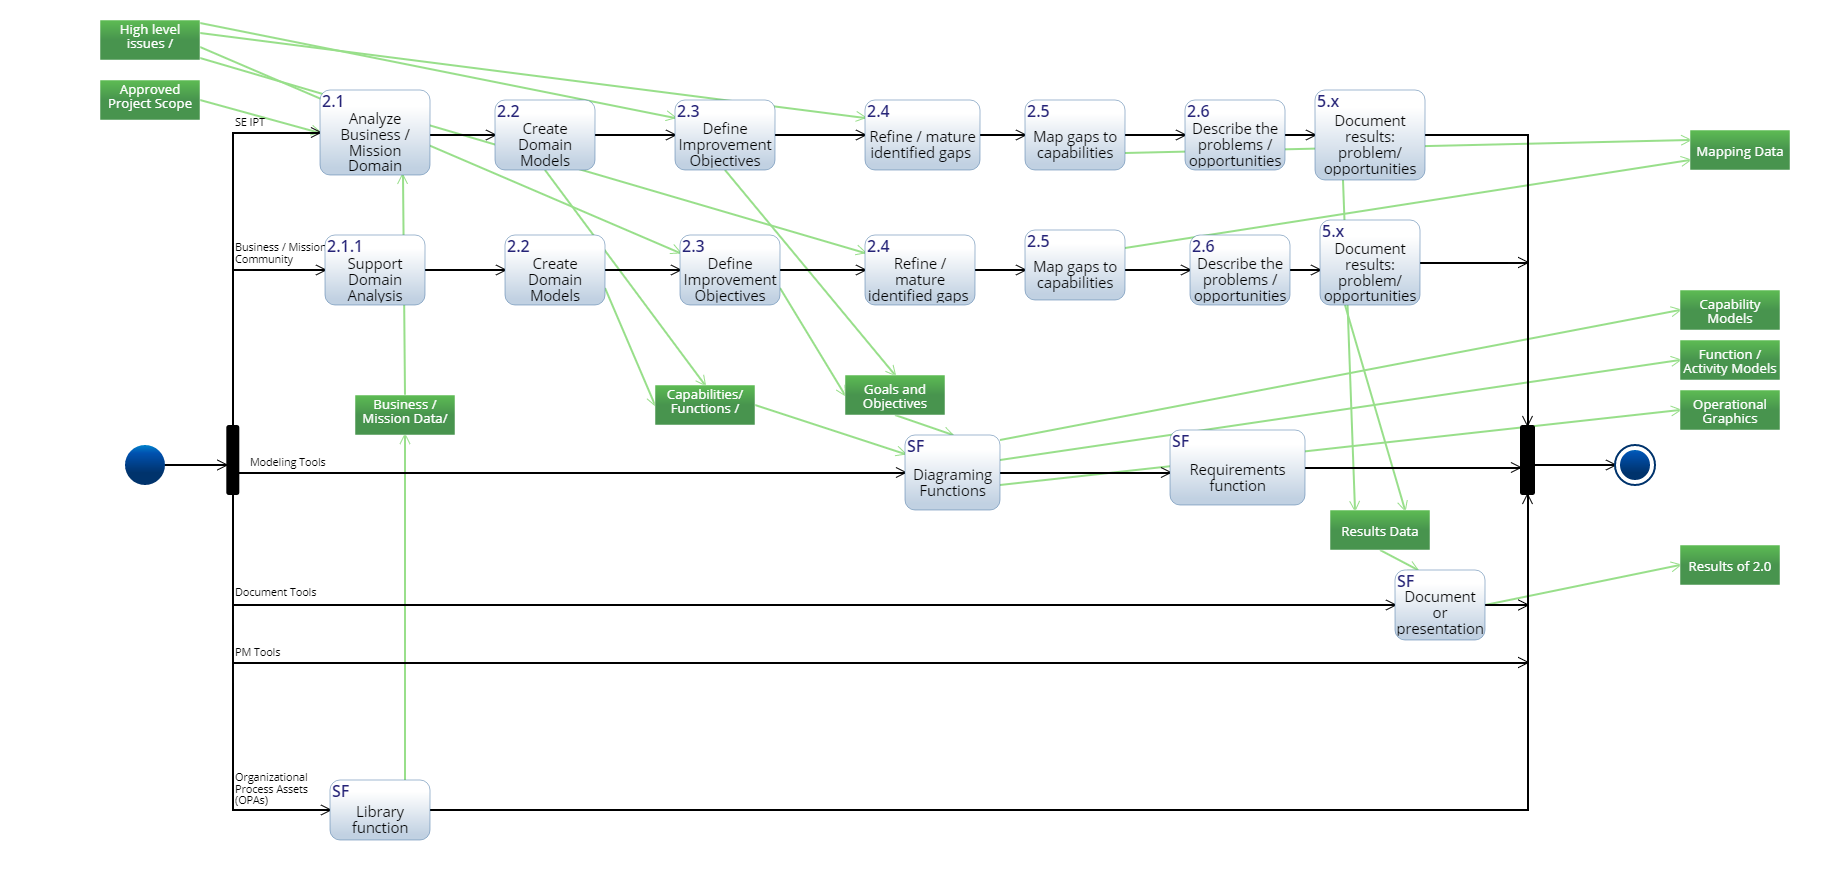
Characterize the Solution Space
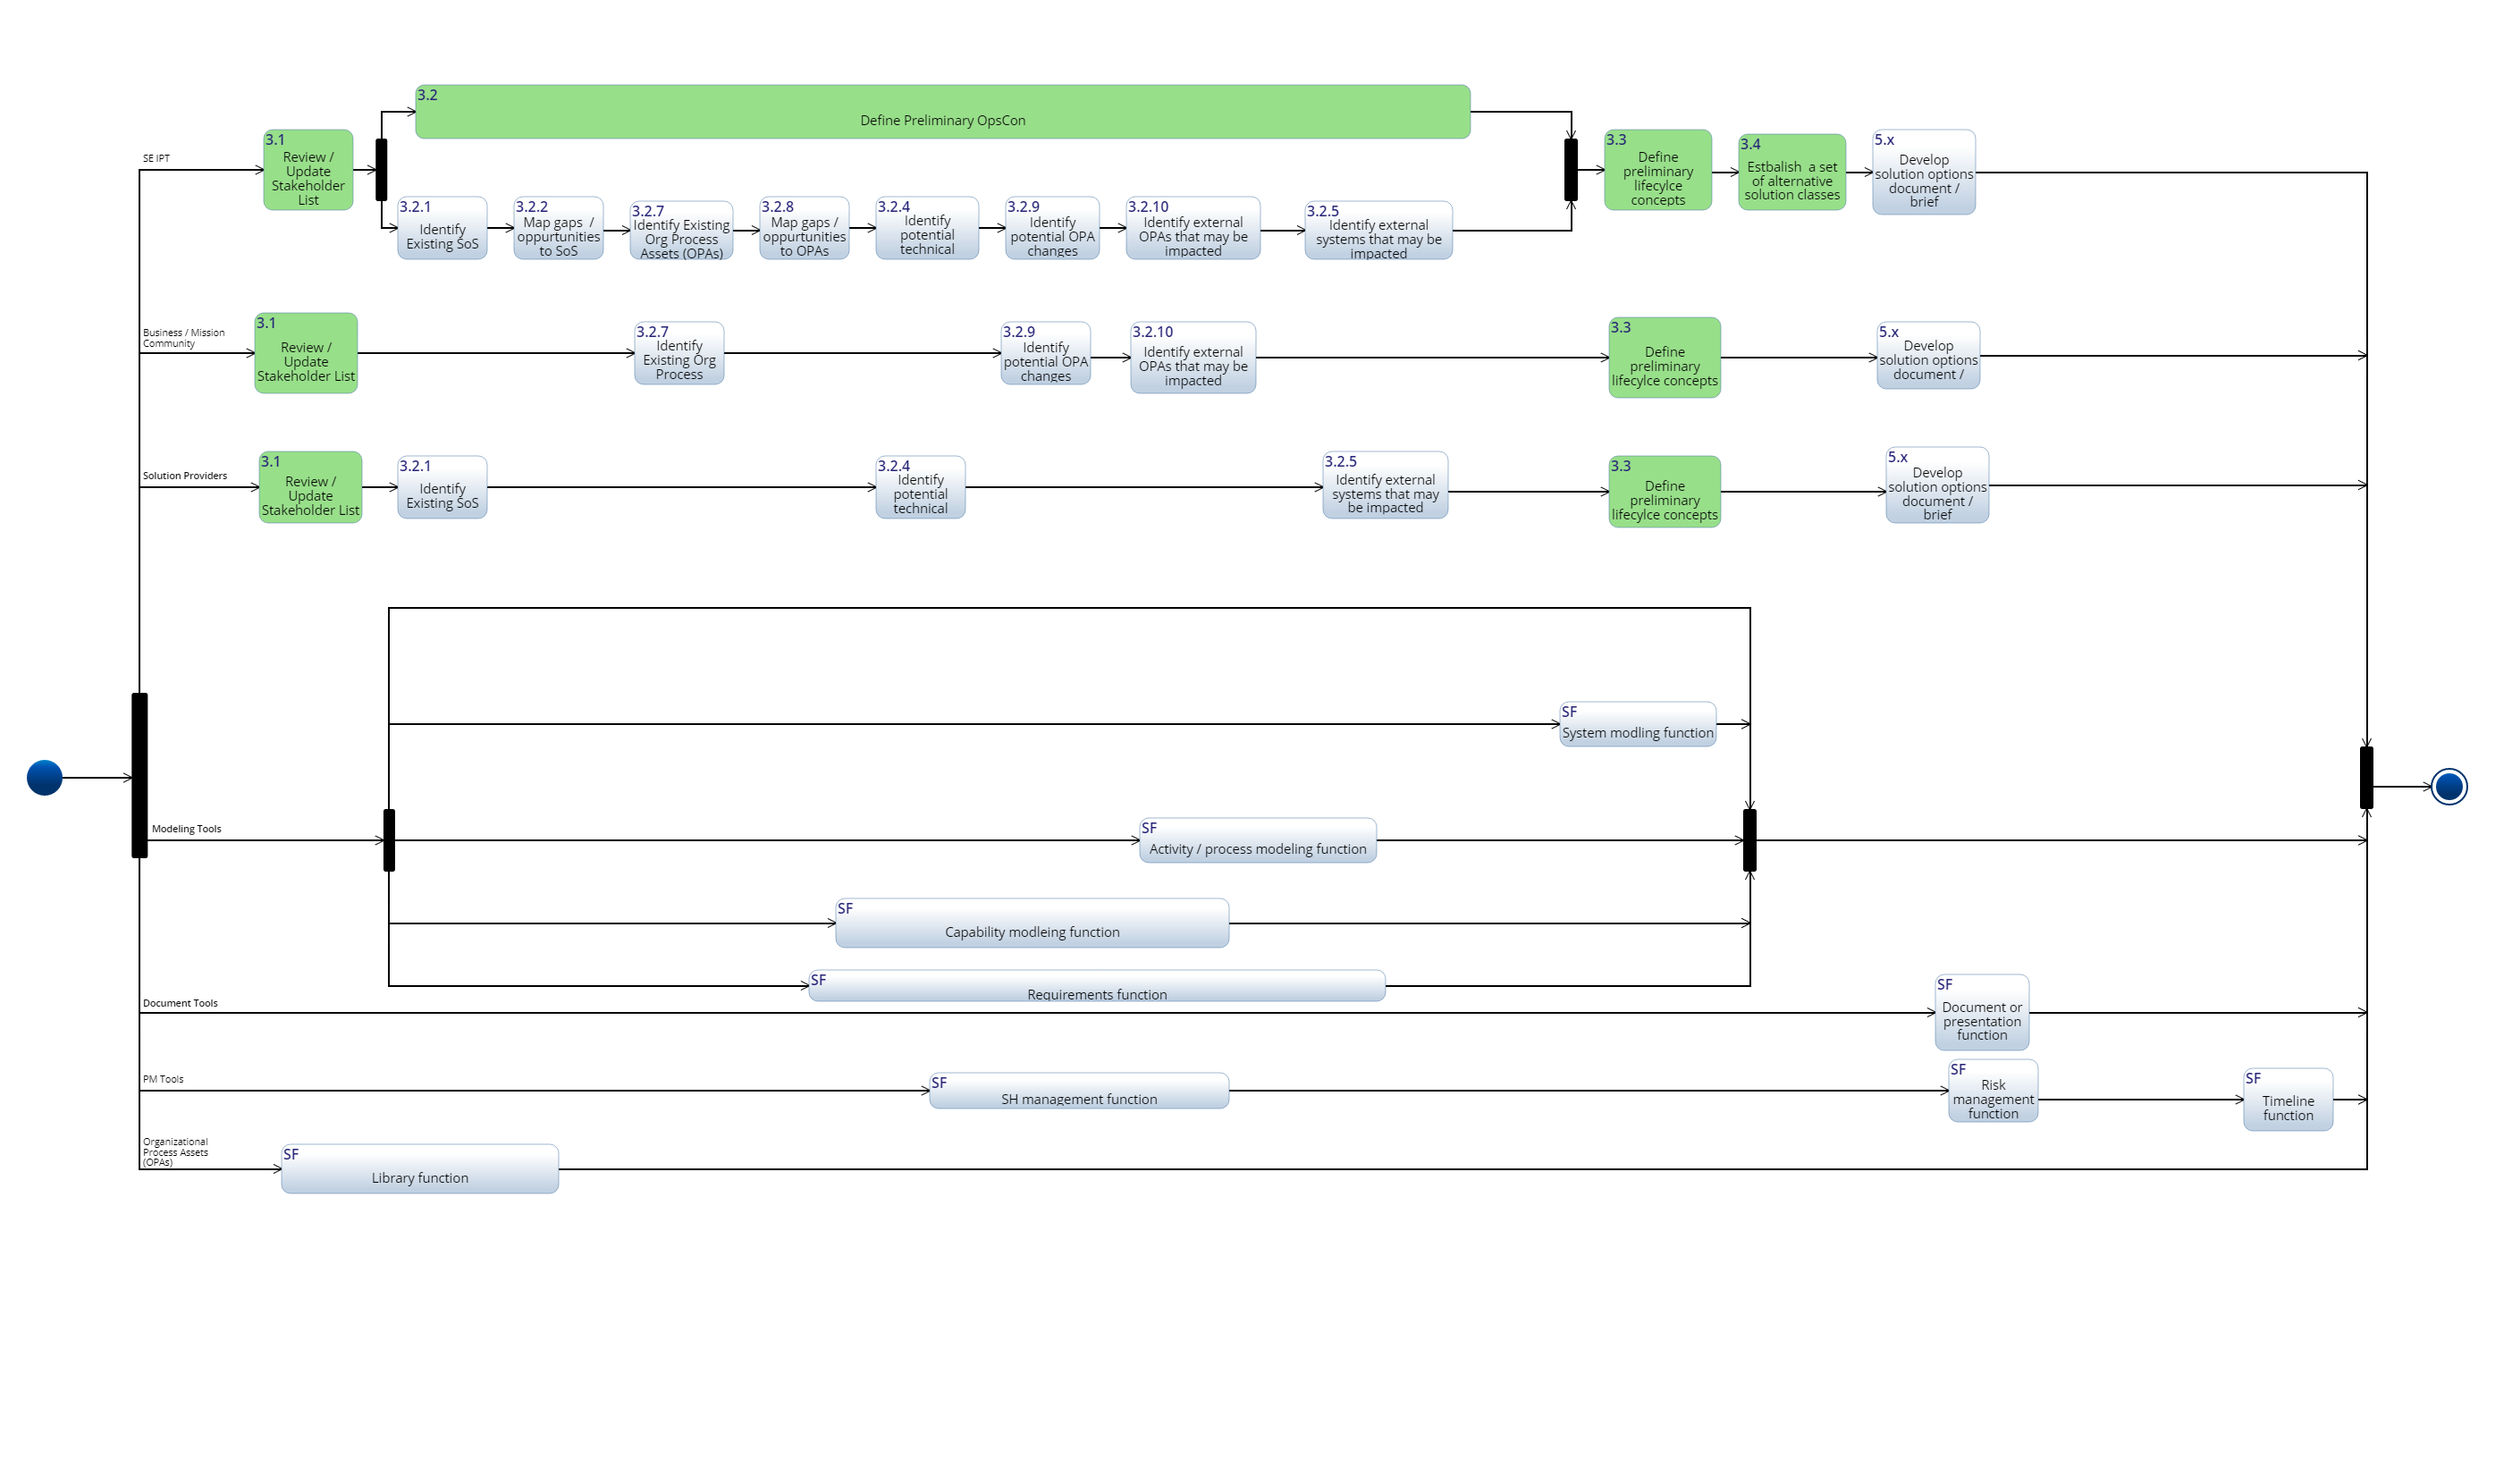
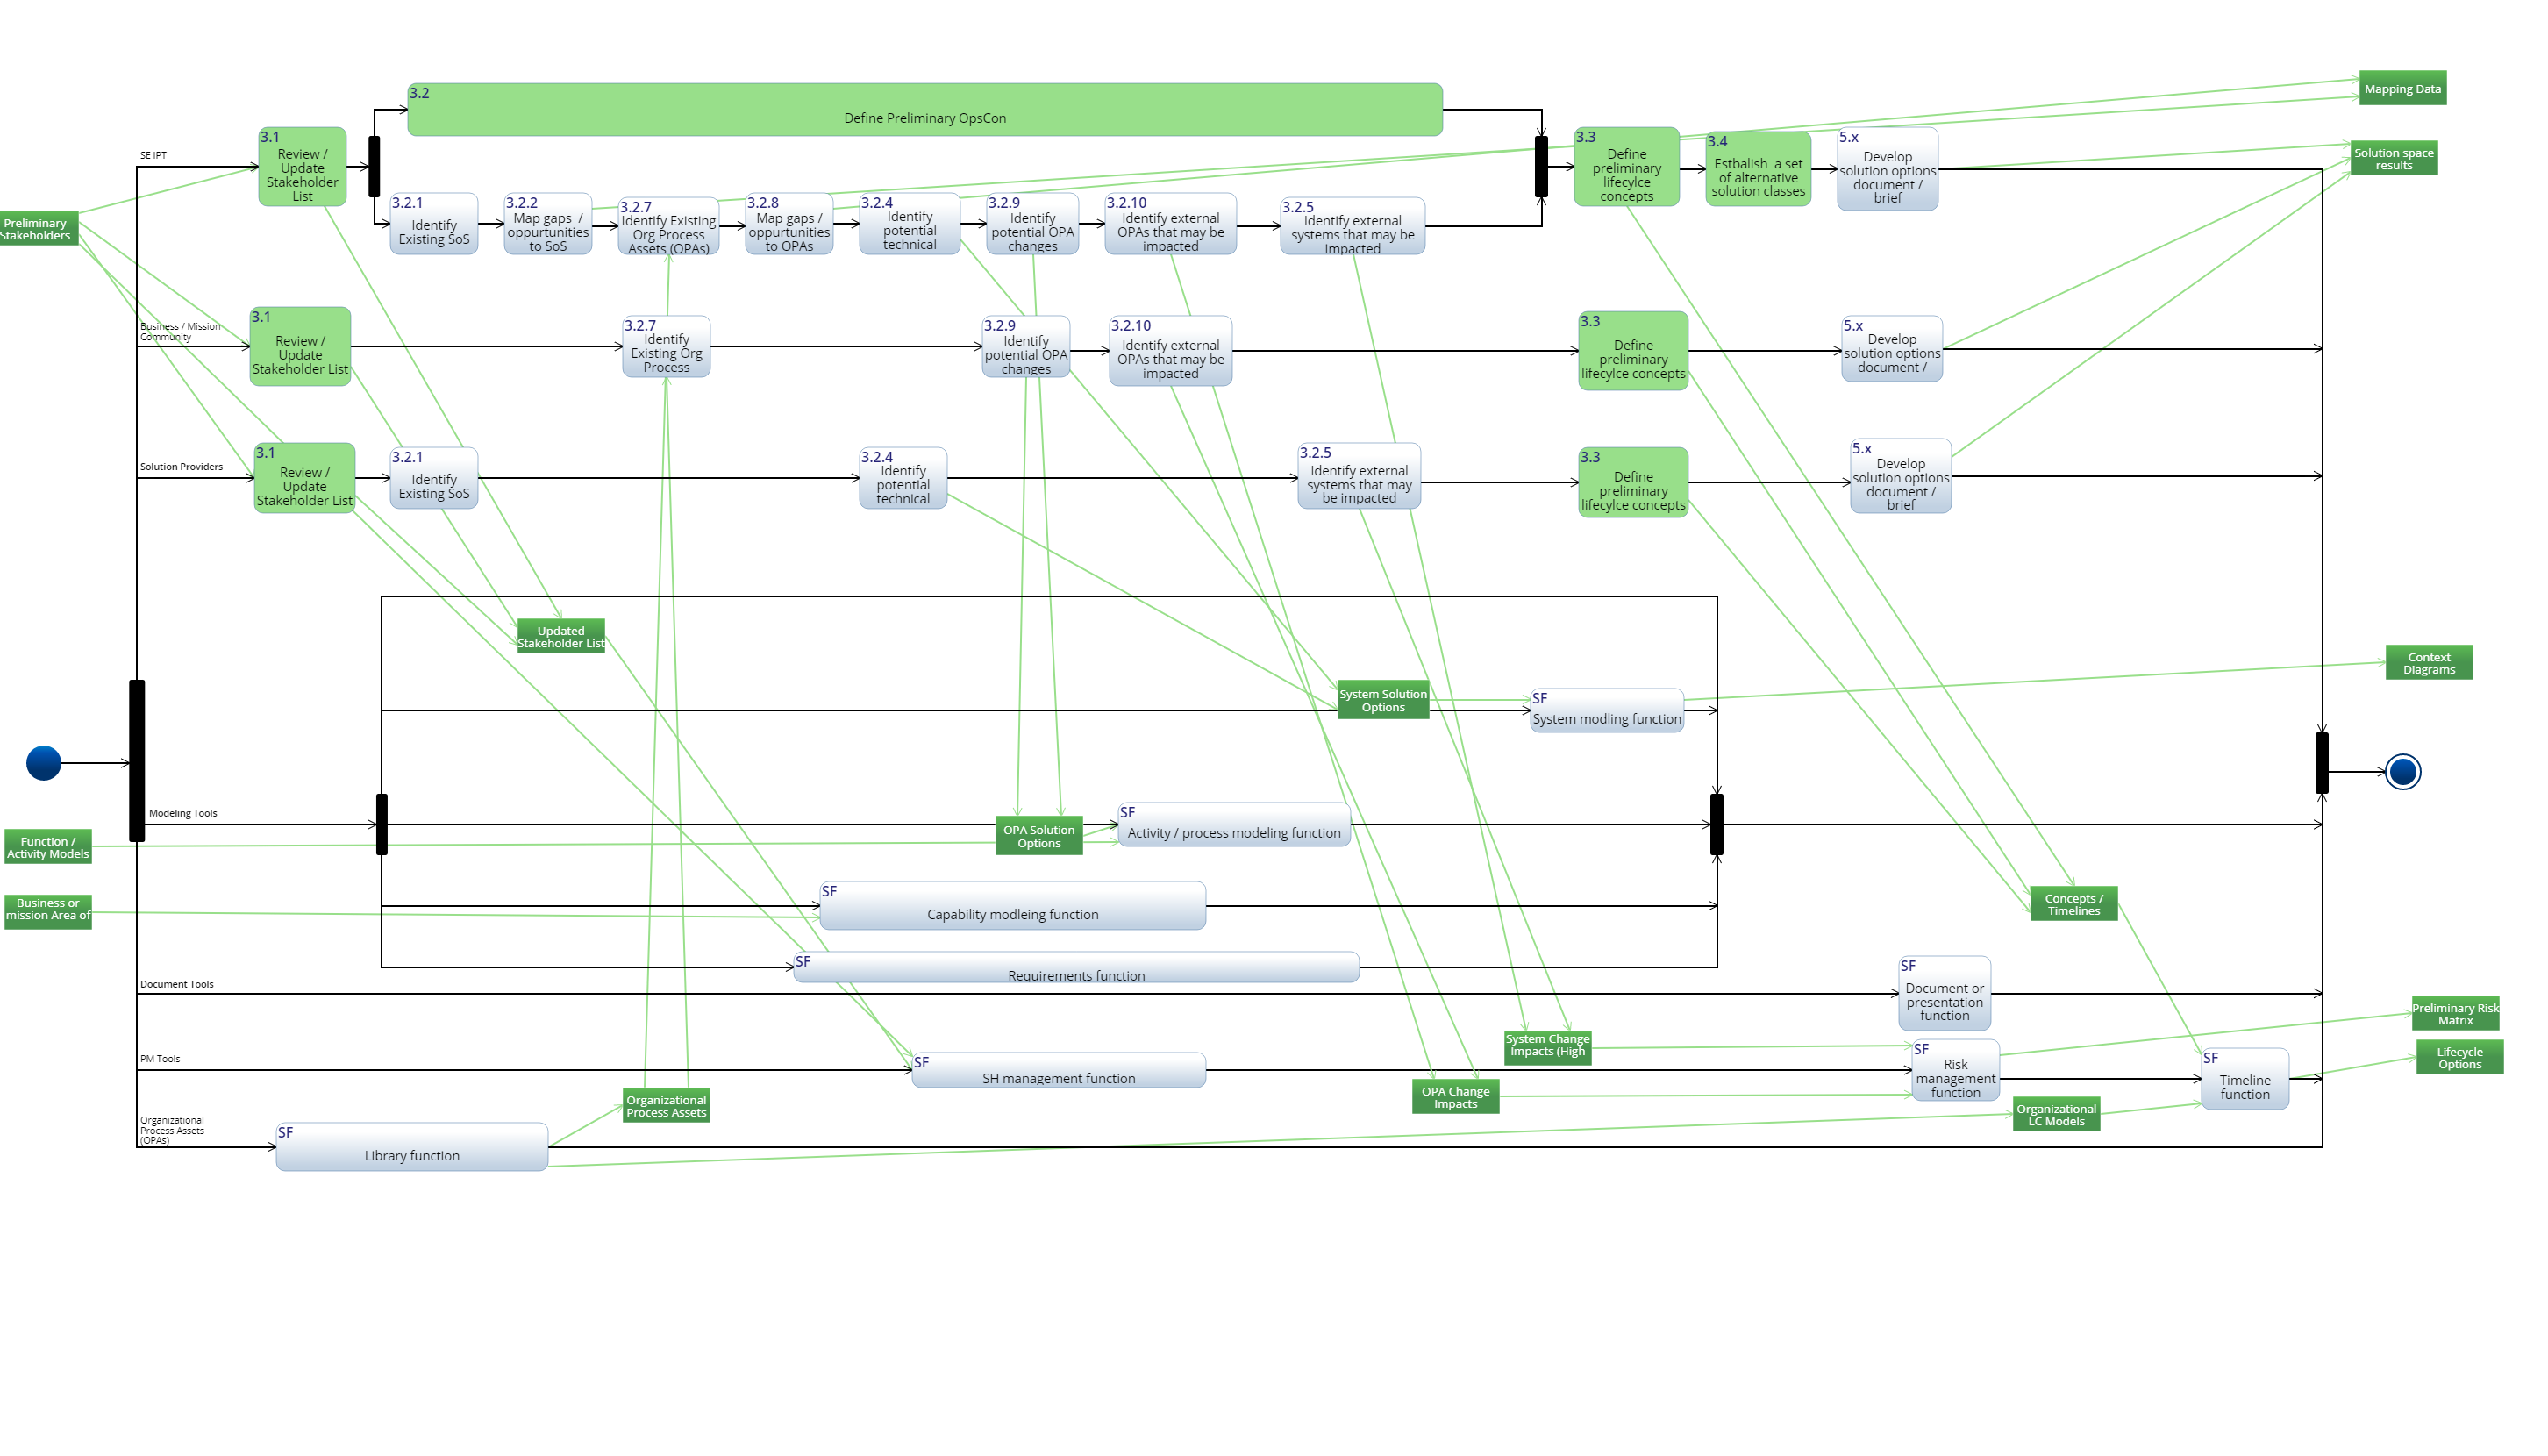
Evaluate Alternative Solution Classes